


KillerNIC is a high-end network card designed for gamers. This review is one of our most extensive with 40 test sessions, resulting in thousands of ping and FPS values. This statistical analysis intends to show whether the KillerNIC has an impact on ping and performance, or not.
For anyone who has played an on-line game, you know there is one thing that will cause a gamer to devolve into a devilish fiend and launch into a cuss-filled tirade like no other: LAG. Just about any other variable in a gamer’s arsenal can be controlled, improved, or maintained, but lag is apparently the one remaining thorn in their collective sides that remains untouchable. Lag is the curse of the gaming world, the demon that apparently cannot be exorcised. Apparently, until the arrival of the Killer NIC, a product that claims reduced ping, improved frame rates and responsiveness. Is it the savior to gamers’ pleas for lag mercy, or a false prophet in disguise? Today we’ll examine the Killer NIC and help answer whether it can live up to those claims and its name.
 |
There is perhaps no other product that is more controversial and generates more heated debates around the ’Net than the Killer NIC. It makes big claims, and the difficulty is that traditional testing methods may not give a full representation of the card’s abilities. As a result, I’ve spent weeks testing and exploring the Killer’s resulting impact on lag, framerates, and responsiveness, running it through the paces, gathering massive amounts of data. Some of the results are rather interesting, and you may be surprised as well. Underlying all the hype and data, however, there is essentially one basic premise we will attempt to clearly answer for you today: Does the Killer NIC make a difference, and if so, how much?
Read on to find out…
Lag: Cause and Effect
In order to understand how a Killer operates, we must first understand why a Killer exists. The main reason for the Killer’s existence is simple: LAG. Anyone that has played an on-line multiplayer game understands what lag is; intermittent stuttering and choppiness that takes away the smooth gameplay necessary to play enjoyably and successfully on-line. So what causes lag? Well, there are a number of factors and variables that can attribute to lag and that requires a bit more in-depth discussion to understand why it exists, and how the Killer NIC attempts to correct or improve it.
A quick recap on Internet 101: The Internet is a collection of networks that transfers information between computers, and in the case of online gaming, between your PC and ultimately the server you are playing on. Information is generally transferred quickly and efficiently in packets between the host (server) and client (you). Often times the flow of this information or packets can become congested, delayed, or even dropped. Keep in mind that on-line games are played in real-time, which means that delays in the transfer of packets means delays in your game. So, quite simply, if these delays (called packet loses) become too large or happen too frequently, then you experience those effects, and this is called LAG. When the flow of information resumes or increases and the lag subsides, then your game responds similarly, but it can’t ”catch up”, so it resumes where the flow of information is. This means that you essentially lose that gameplay during the lag, and your game resumes at the new point, meaning that you could be halfway across a map, or more than likely if you’re playing a shooter game: dead. There is nothing quite as frustrating as trying to shoot someone who is lag-jumping. They’re almost impossible to hit. And there is nothing quite as humorous as watching someone else lag-die. Except of course when it is you who died. Then it’s the most frustrating and cuss-inducing experience when you get the jump on someone and are about to get that point or kill, only to get hit with lag and then realizing that your helicopter slammed into a mountainside, and all your clan mates are laughing their butts off at your misfortune.
The Killer NIC is a client-side product, so there is a limit as to what it can control in those operations of packet-transfer that causes lag. It cannot control the Internet, it cannot control the game server, and it cannot control how your ISP prioritizes its traffic and bandwidth. So what can it do? Well, it can address client-side lag and its causes. So the question then becomes: how does the Killer do that, and what kind of impact can that make? Let’s examine that right now.
Combating Lag
Since the Killer NIC is a client-side product, Bigfoot Networks states it can combat lag in a few ways: optimization, prioritization/allocation of resources in your computer system and the incoming packets of information. This ”plan” of attack is what Bigfoot refers to as their ”Lag and Latency Reduction (LLR)” technologies. Let’s take a bit of a closer look at what this entails and briefly how it works, in order to better understand how the Killer NIC works.
The basic technology that the Killer NIC employs is based upon the relationship between latency and throughput. Essentially, networking performance can be optimized to improve either latency or throughput. It is important to note that there is a balance here, and one plays off the other. In order to increase throughput and lower CPU usage, this is normally done by queuing those transfer packets. The more packets that are queued before an interrupt is used to transfer them, the lower the CPU usage and the higher your resulting throughput. However, this comes at a stiff price, because the more packets that are queued, the longer the delay until they are transferred. And remember how we talked about transfer delays being the cause of lag? Well, this means that those bigger stacks end up translating into higher latency and therefore LAG. So this process of stacking doesn’t help gamers, who aren’t particularly interested in throughput numbers. So the key to reduced lag in this sense, is reducing the delay in that stack, and quickly transferring the information packets. In order to accomplish this, the Killer NIC utilizes a ”1-packet, 1-interrupt” transfer model to eliminate this queuing operation that standard NICs use by default. When the Killer is switched into ”Game Mode”, the card’s networking stack replaces the Windows stack. Depending on the packet size and the application being run, there is generally anywhere from a 3-10 ms delay in the queue and process of these packets in the Windows stack. According to Bigfoot, this translates into a reduction in latency, possibly 3-5 ms per packet.
The Killer NIC also strives to combat lag by the inclusion of a NPU (Network Processing Unit) onto the card itself. This processor runs both the 1-packet, 1-interrupt model, as well as replacing the Windows networking stack. This allows the Killer to offload TCP and UDP calculations from the CPU, which should free up cycles to be used on the game engine instead. So the NPU is designed to reduce that load and theoretically increase frame rates in games. It is important to realize, however, that every game is designed differently in how their engines handle network stacks. As a result, there can be mixed performance results in various games.
The other method the Killer uses to combat lag is prioritizing the data packets and game network traffic. Some standard NICs can prioritize outbound packets, but the Killer claims to control and prioritize both inbound and outbound packets. The Killer apparently prioritizes packets to ensure that your gaming data gets preference over other network traffic moving in and out of your system. This may not help your latency per se, but in theory it should help achieve that ”smoothness” that Bigfoot claims.
Let’s now take a look at a Killer…
Let’s take closer look at the card itself. Since the Killer NIC is primarily marketed to the enthusiast and gamer crowds, we can see that the packaging and content have a bit of flash.
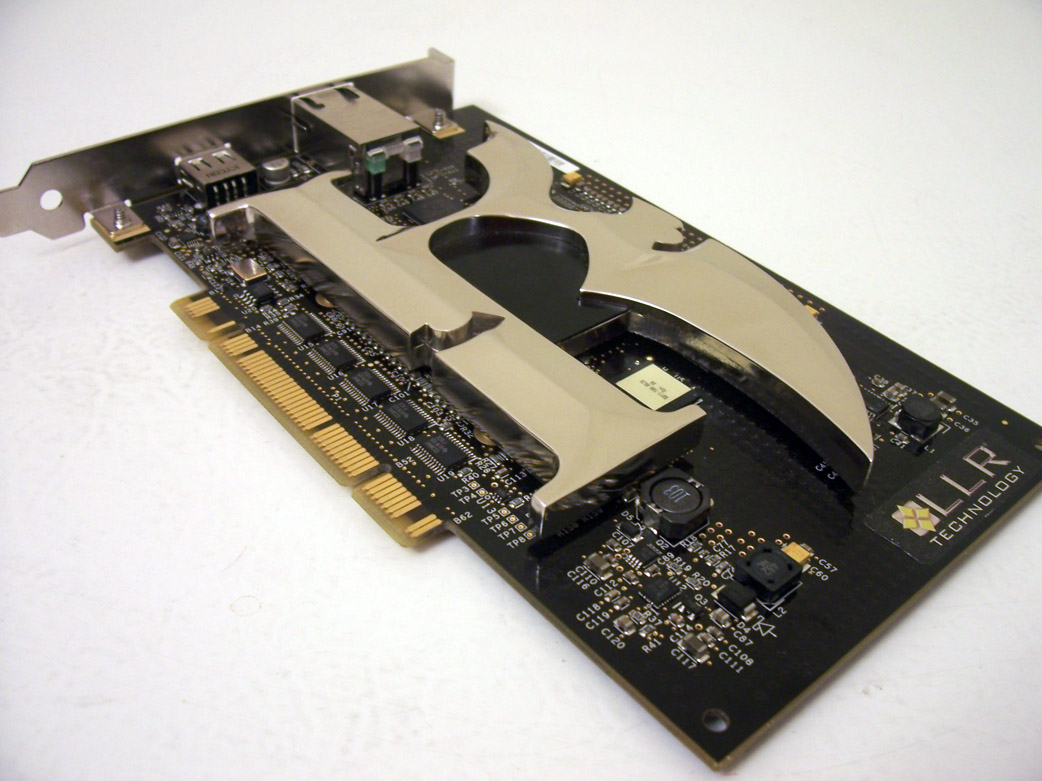
Next we see the Killer NIC itself. A black card, a huge shiny heatsink, and LEDs when in operation make this card either brash or sexy, depending on your perspective. Either way, it is instantly recognizable, and the heatsink fashioned in the letter "K" certainly adds to the style. The heatsink is huge, and I can verify it is needed, as it gets rather warm during gaming due to the NPU working under load. Unfortunately, even with a windowed case, these features won’t be noticed since they’ll be on the bottom, unless you have a BTX setup and/or a shiny case interior where the LEDs will get more noticed.
 |
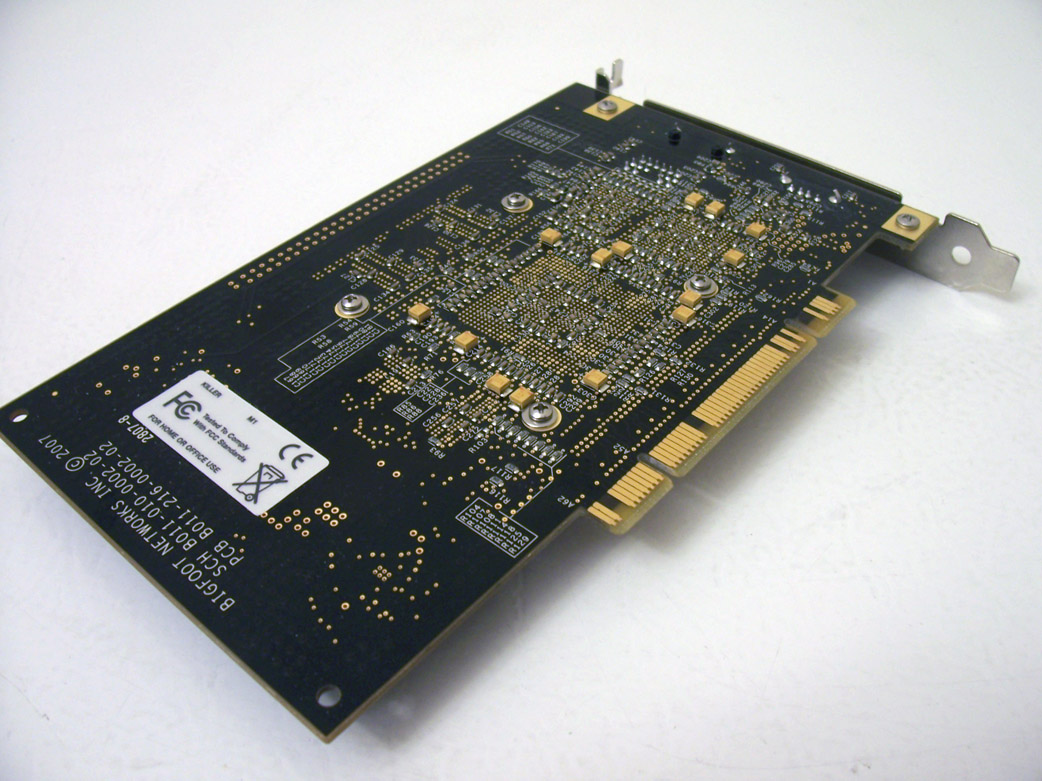
The Killer is only available in a PCI interface. This is apparently to make the card more accessible to a wider range of gamers who will have varying system specifications and hardware capabilities. While there have been some rumblings from people about a lack of PCI-express interface, PCI offers enough bandwidth to satisfy modern online gaming demands. The difficulty, however, isn’t with the PCI interface; rather, it lies in motherboard designs. Increasingly, the number of PCI slots in motherboards has been reduced lately. It is not uncommon to find even a top-end motherboard with only 2 PCI slots. Consider that the average gamer usually has at least a sound card, and possibly one other device, there could very well be issues with a shortage of slots. In any regard, this isn’t Bigfoot’s fault, just a note to potential consumers to ensure you have an available PCI slot.
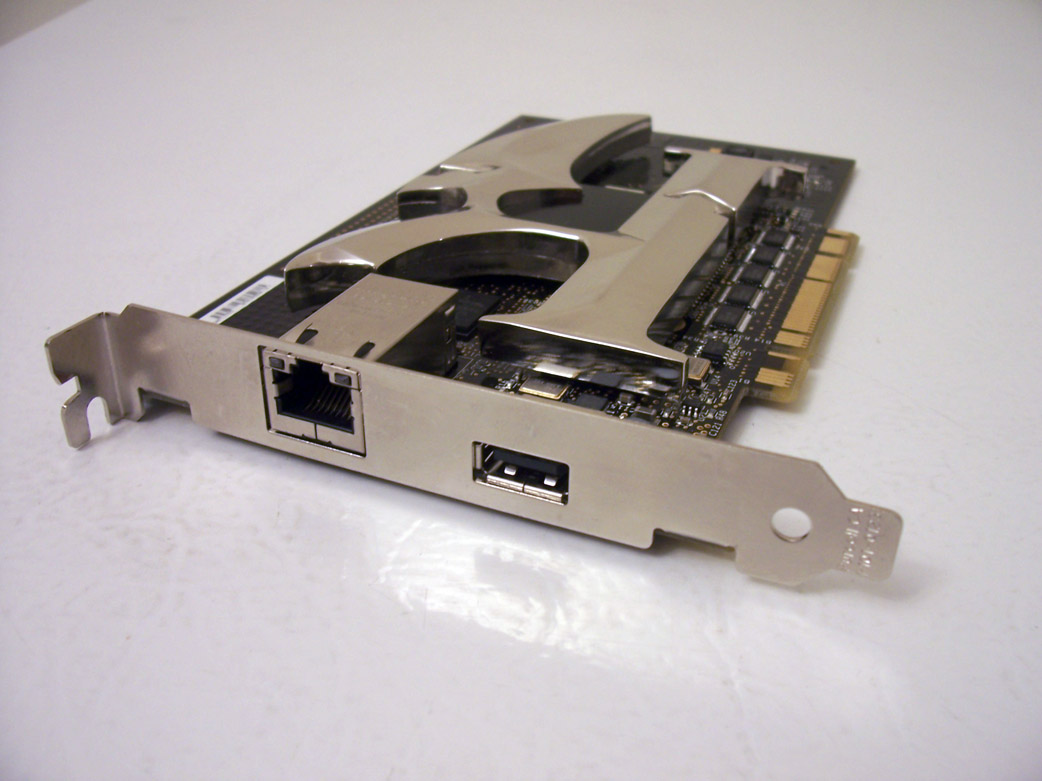 |
At the rear of the card we see the Ethernet port with status LEDs, and a USB port that opens up some interesting possibilities for Flexible Network Architecture (FNA) applications. Essentially, FNA apps are Linux programs that can be used for a variety of network-related or communication-based tasks. Similar to the offloading described previously, these FNA apps can also offload network traffic and be controlled via the NPU. There are several FNA apps that are currently offered for the Killer, such as FNA Torrent, FNA Firewall, FNA FTP, FNA Telnet, FNA Patcher, and finally a FNA Dev Kit which includes the full source code for Linux Kernel, compiler, etc to make your own FNA apps. Each of these apps are designed to take advantage of the capability of the Killer’s NPU and network prioritization features.
There is one other feature worth mentioning about the Killer’s capabilities. Currently in Beta, Bigfoot has teamed up with DiamondWare to develop a hardware-accelerated VoIP for gaming that offloads the client-side processing as well to the Killer NIC. As with the other features, this should reduce the CPU overhead and remove any performance hit during gaming.
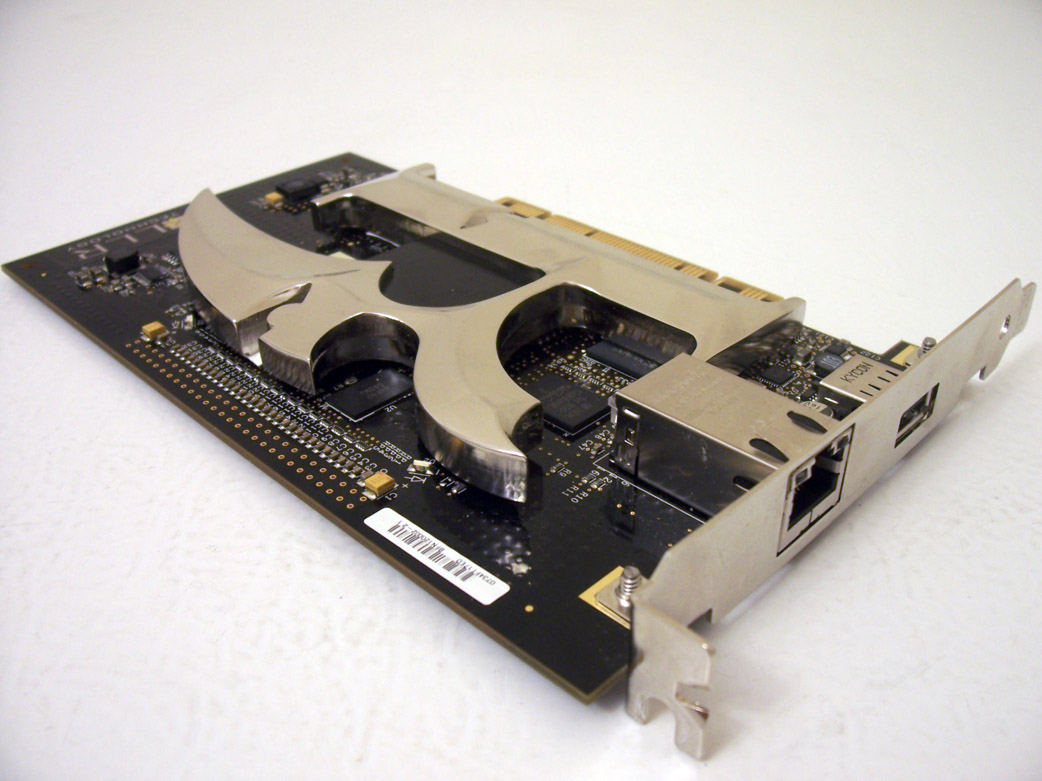
A couple of more views of the Killer:
 |
 |
Considering the claims and capabilities of the Killer NIC, we determined that the test setup used for this evaluation would be high-end. However, we’ve also received many inquiries and requests as to how an entry-level system would perform with the Killer installed. This has been asked primarily by people who do not have the money to upgrade their whole system, and could use the Killer in the meantime and then also after they upgraded. Interestingly enough, most of the inquiries came from World of Warcraft players. We’re pleased to say WoW was included in our tests, and to help answer those questions, we also used a second test setup that represented a more entry-level system.
The system specifications for the two systems are as follows:
| TEST SYSTEM # 1 | |
|
Hardware
|
|
| Processor | Intel Core 2 Duo E6850 @ 3.0GHz, 4MB cache |
| Motherboard | EVGA 680i (BIOS P31) |
| Memory | 2 x 1024 Crucial Ballistix Tracer PC2-8500 (DDR2-1066) |
| Graphics Card | EVGA GeForce 8800 GTS 640 |
| Power Supply | Coolermaster Real Power Pro 850W |
| Storage | 2 x 74GB Western Digital Raptors in RAID0 |
| Case | Antec P180b |
| Cooling | Coolit Freezone |
|
Software
|
|
| Operating System | Windows Vista Ultimate 32-bit |
| Graphics Drivers | Nvidia Forceware 163.75 |
| Product Drivers | Killer Software Suite 3.1.3.0 – Windows Vista 32-bit |
| Testing | FRAPS 2.9.2 |
| TEST SYSTEM # 2 | |
|
Hardware
|
|
| Processor | Intel Core Duo 2180 @ 2.0GHz, 1MB cache |
| Motherboard | Gigabyte 965P-DS3, Rev.3.3 (BIOS F11) |
| Memory | 2 x 1024 Corsair XMS PC2-5400 (DDR2-667) |
| Graphics Card | BFG 7600 0GT OC |
| Power Supply | Seasonic Energy Plus 650W |
| Storage | 500GB Seagate Barracuda 7200.11 |
| Case | Gigabyte 3D Aurora |
| Cooling | Stock Intel CPU heatsink |
|
Software
|
|
| Operating System | Windows Vista Ultimate 32-bit |
| Graphics Drivers | Nvidia Forceware 163.75 |
| Product Drivers | Killer Software Suite 3.1.3.0 – Windows Vista 32-bit |
| Testing | FRAPS 2.9.2 |
Our test systems use Intel Core 2 CPUs, as they represent excellent performance-to-price, and are very popular amongst enthusiasts. Specifically, the E6850 is the fastest dual-core chip available and should prove up to the task for these gaming tests. For the entry-level system, a 2180 model was used, providing a good balance of price and performance. The graphics cards used represent virtually opposite ends of the spectrum, with first system loaded with an 8800 GTS, and the second system sporting a 7600 GT, which was a very popular card not that long ago, and still continues to perform reasonably well in recent games at medium- to lower-resolutions. In both systems, a 2GB memory configuration was chosen, as most gamers are currently using this setup in their systems. The 680i chipset was used in the high-end system, as this has proven to be very popular among gaming enthusiasts, offering good overclocking capabilities and the opportunity to utilize SLI should the desire arise for users. The Gigabyte DS3 was used in the entry-level system, as this was an extremely popular and solid board, probably one of the best 965 boards ever produced, and remains in use by many gamers.
Lastly, Windows Vista was used for the tests. Without delving into debates surrounding the performance differences and pros/cons, suffice it to say that the likelihood of running into troubles with the Killer is more probable in Vista than in WinXP, so Vista was the OS of choice here.
Installation of the Killer NIC is straightforward, simply turn off your computer, insert the Killer into an available PCI slot, plug your Ethernet into the Killer, and turn on your system. Insert the accompanying CD, and install the software. After installation, the Killer’s default settings should be fine. If, however, you wish to tweak some settings further, you can do so in the configuration menu. With the Killer installed, there was an increased time to boot into Windows. The increase in boot time was not significant, but it was noticed. Beyond that, no installation issues were noted, with one exception:
During our initial testing, there were intermittent connection problems and other unusual things happening with the Killer. Thinking it may have been a Vista problem, we switched to XP and another system but still experienced the same issues. Upon discussing the problem and troubleshooting with a Bigfoot engineer, we determined the card was defective. Bigfoot very quickly sent a replacement card and then no further problems were experienced, neither in Vista nor in XP. Kudos to Bigfoot for their helpful and quick-reacting support team. To ensure accurate results, any test data that was not fully complete was tossed out and new tests were started over. Any test data already complete was verified with the new Killer card to ensure no anomalies occurred as a result of the defective card. Results within 1% were considered accurate.
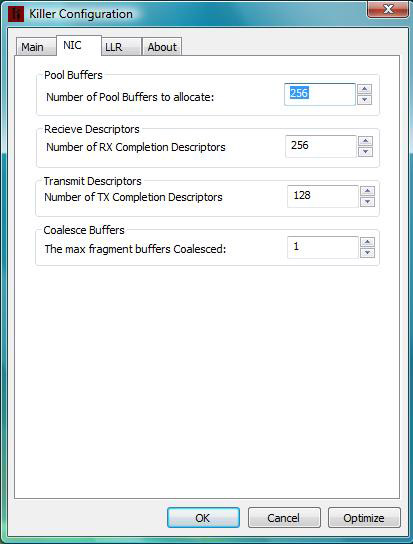
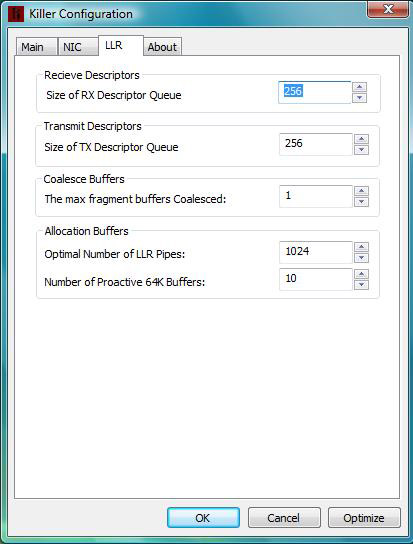
Below are screenshots of what the Killer configuration menu will look like, and the associated features as well.
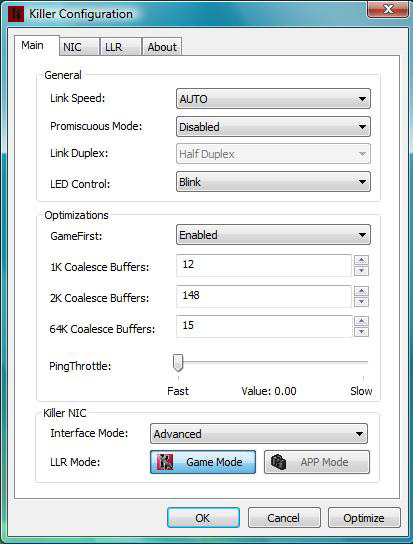 |
As you can see, you have the ability to "ping throttle" the Killer, so as to adjust your ping values to the outside world and your competition. I’m not entirely sure of the rationale for this, but I suppose if you want to trick others for some reason then you have the opportunity to do so.
 |
 |
As stated at the outset of this evaluation, to say that the Killer NIC’s claims are somewhat controversial would be an understatement. In order to give the product a fair opportunity to showcase its supposed talents, and in order to be objective and fair to the integrity of the tests, a fairly simple but extremely extensive test was used. As has been pointed out, lag is a product of many things, some of which are beyond the client’s control. So in order to attempt to evaluate the Killer’s effectiveness, as many variables were kept consistent as possible. Also, a very large test sample was used to account for any minor differences in net traffic, frame rate differences, and so forth. Ultimately, our purpose here is to provide objective and unbiased results, based on thorough testing, and let the numbers speak for themselves. So, here’s what we did:
- Tests were run on four popular on-line multiplayer games (3 shooter and 1 MMORPG), these were: Battlefield 2, Team Fortress 2, Call of Duty 4, and World of Warcraft.
- Tests for each game were conducted on the same server, on the same map, with a server full of on-line players
- Tests were conducted at various times of day and night, and were at similar times with the card installed and not installed
- Each game was tested 10 times with the on-board NIC, and 10 times with the Killer NIC installed
- Each test lasted 15 minutes in length. FRAPS was used to record the min/max/avg framerates, and ping values were recorded manually every 30 seconds through each in-game menu
Note: in the case of World of Warcraft, the same realm, and the same area of the map, along with similar battle sequences were used for the tests. This made for very monotonous gameplay, but ensured any variability in frame rates and pings caused by different realms or encounters would be eliminated.
So, for ping values, we achieved a sampling that equaled 15 minutes (test length) x 2 (per minute) x 10 (test runs) x 2 (Killer, no Killer) x 4 (games tested) = 2,400 ping values!!! Needless to say, that is a TON of ping values, more than enough to see whether the Killer makes a difference, especially considering the test conditions on the server were the same as much as possible each time. As stated at the outset, extensive testing over weeks of time was spent for this evaluation, and we are very confident of the consistency of testing and the sample size to gauge the effectiveness of the Killer.
In order to record frame rates, FRAPS was run during all 15-minute tests each time and gave very accurate data for each test situation, with and without the card installed.
All the numbers were recorded in a spreadsheet, each test’s numbers were averaged, and then run through our statistical analyser, and the results were churned out. After weeks of testing and chomping at the bit to see the results, we finally have the numbers to show.
For each game we’ve compiled a rather big table with data from the tests. The results from the KillerNIC and on-board NIC tests were compared using Student’s unpaired t-test. Below is an explanation of the table.
|
Battlefield 2 – Ping
(lower is better) |
||||||
|
Min
|
Max
|
Average
|
||||
|
KillerNIC
|
Onboard
|
KillerNIC
|
Onboard
|
KillerNIC
|
Onboard
|
|
| Test 1 |
117
|
118
|
120
|
120
|
119.6
|
120.2
|
| Test 2 |
118
|
118
|
121
|
119
|
120.1
|
118.6
|
| Test 3 |
118
|
119
|
120
|
121
|
119.5
|
120.6
|
| Test 4 |
119
|
119
|
122
|
122
|
121.4
|
121.3
|
| Test 5 |
118
|
117
|
120
|
119
|
118.8
|
118.8
|
| Test 6 |
117
|
118
|
119
|
120
|
118.5
|
119.3
|
| Test 7 |
118
|
118
|
120
|
121
|
119.8
|
120.3
|
| Test 8 |
119
|
119
|
121
|
122
|
120.4
|
121.2
|
| Test 9 |
118
|
117
|
120
|
119
|
119.3
|
118.5
|
| Test 10 |
117
|
118
|
120
|
119
|
119.2
|
118.9
|
| Mean |
117.9
|
118.1
|
120.3
|
120.2
|
119.7
|
119.8
|
Here is the raw data from the test runs and the arithmetic mean:
The formula may look like space language to the average Joe, but it simply means that we add up all sample data and divide them with the number of samples.
The above table is divided into three sections; Min (minimum), Max (maximum) and Avg (average). Each section holds two columns where the left shows the Killer and the right the onboard NIC.
| KNIC/Onb. x100 |
99.83
|
100.08
|
99.92
|
For your convenience we took the mean values, divided them by each other and multiplied them by 100. This gives you a hunch of the difference in percentage. In the case of ping, lower than 100 means that the KillerNIC is better. In the FPS tables, higher than 100 is an improvement over the onboard NIC. The distance from the null value, 100, is the same as the performance increase/decrease in percentage. E.g. 104.68 implies that the KillerNIC mean is 4.68% higher than the onboard NIC mean.
| Standard deviat. |
0.738
|
0.738
|
0.824
|
1.229
|
0.833
|
1.077
|
| Stat. significance |
No
|
No
|
No
|
|||
| t value |
0.6061
|
0.2137
|
0.2555
|
|||
| P value |
0.5520
|
0.8320
|
0.8013
|
|||
Here we have the statistics. We’ve included both t and P values, and if you want you can look up the table values and compare to ours, but we’ve already done that and given you the results in the row called ”Statistical significance”. It states short and simple whether there is a proven and statistical significance between the Killer and the onboard NIC. In some tests you will see that there is a difference of a few percent between the Killer and the onboard NIC, but it will still say No under Statistical significance. This means that the difference between the two means is too small and/or the variation within the data is too large for us to say for certain that there is an actual difference. Statistically speaking there is no difference between the cards in those cases.
However there is more than figures to the Killer and I urge you to read the comments for each game, because even though the results may seem very clear in the tables, the actual gaming experience could not always be linked to the numbers.
So, without further delay, let’s get onto the results!
Of all the tests, this one was probably the most taxing, both in terms of testing and gaming patience. Running around the ”Strike at Karkand” map in a full 64-player server, with Infantry Only and no vehicles … is about as crazy as it gets. Those of you who play BF2 know what I’m talking about. Staying alive can be tricky (praying you don’t lag-die) and experiencing smooth gameplay during the massive grenade-fests can be next to impossible. What this means is that it was a perfect environment to test the Killer NIC, just the thing needed to see what the card can really do.
Here we see the results for frame rates and ping on Battlefield 2:
|
Battlefield 2 – Ping
(lower is better) |
||||||
|
Min
|
Max
|
Average
|
||||
|
KillerNIC
|
Onboard
|
KillerNIC
|
Onboard
|
KillerNIC
|
Onboard
|
|
| Test 1 |
117
|
118
|
120
|
120
|
119.6
|
120.2
|
| Test 2 |
118
|
118
|
121
|
119
|
120.1
|
118.6
|
| Test 3 |
118
|
119
|
120
|
121
|
119.5
|
120.6
|
| Test 4 |
119
|
119
|
122
|
122
|
121.4
|
121.3
|
| Test 5 |
118
|
117
|
120
|
119
|
118.8
|
118.8
|
| Test 6 |
117
|
118
|
119
|
120
|
118.5
|
119.3
|
| Test 7 |
118
|
118
|
120
|
121
|
119.8
|
120.3
|
| Test 8 |
119
|
119
|
121
|
122
|
120.4
|
121.2
|
| Test 9 |
118
|
117
|
120
|
119
|
119.3
|
118.5
|
| Test 10 |
117
|
118
|
120
|
119
|
119.2
|
118.9
|
| Mean |
117.9
|
118.1
|
120.3
|
120.2
|
119.7
|
119.8
|
| KNIC/Onb. x100 |
99.83
|
100.08
|
99.92
|
|||
| Standard deviat. |
0.738
|
0.738
|
0.824
|
1.229
|
0.833
|
1.077
|
| Stat. significance |
No
|
No
|
No
|
|||
| t value |
0.6061
|
0.2137
|
0.2555
|
|||
| P value |
0.5520
|
0.8320
|
0.8013
|
|||
|
Battlefield 2 – FPS
(higher is better) |
||||||
|
Min
|
Max
|
Average
|
||||
|
KillerNIC
|
Onboard
|
KillerNIC
|
Onboard
|
KillerNIC
|
Onboard
|
|
| Test 1 |
33
|
32
|
99
|
99
|
64.5
|
78.4
|
| Test 2 |
35
|
29
|
101
|
101
|
77.9
|
76.3
|
| Test 3 |
37
|
28
|
100
|
101
|
74.7
|
80.3
|
| Test 4 |
54
|
32
|
101
|
99
|
96.3
|
79.9
|
| Test 5 |
42
|
42
|
101
|
101
|
95.4
|
74.5
|
| Test 6 |
36
|
36
|
101
|
101
|
82.5
|
86.6
|
| Test 7 |
41
|
29
|
99
|
99
|
78.2
|
78.2
|
| Test 8 |
52
|
33
|
99
|
98
|
88.5
|
77.4
|
| Test 9 |
39
|
35
|
100
|
101
|
77.6
|
80.6
|
| Test 10 |
34
|
35
|
101
|
97
|
83.7
|
78.5
|
| Mean |
40.3
|
33.1
|
100.2
|
99.7
|
81.9
|
79.1
|
| KNIC/Onb. x100 |
121.75
|
100.50
|
103.54
|
|||
| Standard deviat. |
7.304
|
4.175
|
0.919
|
1.494
|
9.658
|
3.234
|
| Stat. significance |
Yes
|
No
|
No
|
|||
| t value |
2.7064
|
0.9013
|
0.8880
|
|||
| P value |
0.0145
|
0.3794
|
0.3863
|
|||
When we examine the Battlefield 2 numbers, we see the minimum frame rates didn’t dip as low with the Killer installed, and the average overall frame rate increased by approximately 4%. Not a huge boost, but there is a quantifiable difference. On the ping chart, we see virtually identical numbers, and no discernible difference. As previously mentioned, however, there is a qualitative result to speak of. After playing Battlefield for countless hours, I can say that the game felt smoother in heavy battles with the Killer installed. Lag was not eliminated, but instances of stuttering were reduced and the overall experience was improved. This was particularly noticeable during periods of particularly heaving fighting and multiple explosions. It is difficult to reconcile this with the numbers above, and perhaps it may be due to pings being measured every 30 seconds, which is plenty of time for potential lag to subside and recover. This could explain why that ”smoother” feeling was not adequately captured in the numbers recorded. The other tests will help determine if this was a fluke or perhaps a sign of things to come.
Next we have Team Fortress 2…
A very popular multiplayer game that utilizes the Source game engine, Team Fortress 2 is included in Valve’s Orange Box package and has proven to be a fan favorite very quickly. Working together as a team is essential, and the action can get pretty busy in a full 32-slot server. We decided to test on the Fort map, since the action is often very concentrated near the middle bridge area and can tend to get choppy when the fragging is intense. This game will also provide an excellent testing ground for the Killer.
Here we see the results for frame rates and ping on Team Fortress 2:
|
Team Fortress 2
– Ping (lower is better) |
||||||
|
Min
|
Max
|
Average
|
||||
|
KillerNIC
|
Onboard
|
KillerNIC
|
Onboard
|
KillerNIC
|
Onboard
|
|
| Test 1 |
106
|
99
|
112
|
104
|
108.4
|
101.4
|
| Test 2 |
154
|
151
|
159
|
154
|
155.8
|
152.2
|
| Test 3 |
152
|
106
|
156
|
115
|
153.2
|
111.2
|
| Test 4 |
148
|
109
|
153
|
137
|
150.4
|
121.1
|
| Test 5 |
99
|
104
|
104
|
109
|
101.4
|
106.1
|
| Test 6 |
102
|
142
|
114
|
151
|
107.5
|
147.7
|
| Test 7 |
105
|
139
|
110
|
154
|
107.6
|
144.5
|
| Test 8 |
121
|
133
|
129
|
141
|
126.1
|
136.6
|
| Test 9 |
119
|
128
|
125
|
136
|
121.6
|
131.2
|
| Test 10 |
126
|
124
|
132
|
131
|
129.2
|
128.5
|
| Mean |
123.2
|
123.5
|
129.4
|
133.2
|
126.1
|
128.1
|
| KNIC/Onb. x100 |
99.75
|
97.15
|
98.44
|
|||
| Standard deviat. |
21.306
|
18.094
|
20.354
|
18.378
|
20.679
|
17.787
|
| Stat. significance |
No
|
No
|
No
|
|||
| t value |
0.0339
|
0.4382
|
0.2238
|
|||
| P value |
0.9733
|
0.6665
|
0.8255
|
|||
|
Team Fortress 2 – FPS
(higher is better) |
||||||
|
Min
|
Max
|
Average
|
||||
|
KillerNIC
|
Onboard
|
KillerNIC
|
Onboard
|
KillerNIC
|
Onboard
|
|
| Test 1 |
22
|
20
|
158
|
126
|
53.2
|
47.1
|
| Test 2 |
17
|
16
|
131
|
99
|
51.6
|
47.3
|
| Test 3 |
18
|
19
|
116
|
133
|
44.8
|
48.9
|
| Test 4 |
21
|
20
|
119
|
127
|
50.8
|
47.9
|
| Test 5 |
17
|
22
|
119
|
148
|
49.1
|
48.4
|
| Test 6 |
18
|
13
|
128
|
132
|
47.7
|
42.7
|
| Test 7 |
19
|
20
|
131
|
137
|
45.3
|
46.7
|
| Test 8 |
19
|
15
|
133
|
129
|
46.6
|
49.1
|
| Test 9 |
21
|
18
|
146
|
127
|
52.2
|
47.5
|
| Test 10 |
20
|
18
|
121
|
131
|
49.6
|
46.8
|
| Mean |
19.2
|
18.1
|
130.2
|
128.9
|
49.1
|
47.2
|
| KNIC/Onb. x100 |
106.08
|
101.01
|
104.03
|
|||
| Standard deviat. |
1.751
|
2.726
|
13.223
|
12.342
|
2.924
|
1.801
|
| Stat. significance |
No
|
No
|
No
|
|||
| t value |
1.0735
|
0.2273
|
1.7036
|
|||
| P value |
0.2972
|
0.8228
|
0.1057
|
|||
Here we see an increase of approximately 4% on the overall average fram erate, and virtually identical maximum and minimum measurements. As you can see, there is a great variance in the top and bottom frame rates, since Fort has areas of empty and intense gameplay alike. As for pings, there was negligible overall difference, approximately 1.5%. With all the explosions, stuttering did occur, but similar to the Battlefield synopsis, there was a slight general improvement in the playability due to its ”smoothness”. There was discernible lag in the middle of the Fort map, where most of the action is generally concentrated near the bridge, and the Killer did not remove this entirely, but it did seem to help overall. Again, this is a quantitative observation based on many hours of playing Team Fortress 2, and is mentioned to give as broad an analysis as possible.
Now let’s take a look at the results for Call of Duty 4…
One of the newest and most popular multiplayer first-person shooter games, Call of Duty 4 is capable of pushing a system (and its operator) very hard. With split-second decisions needed, frame rates and good pings are critical to success in this game. So we decided to run this test in a Free-For-All Deathmatch in a populated server on the Shipment map, which is a recipe for absolute mayhem, no question. You don’t find much tougher close-quarters fighting, with explosions, flashbangs, smoke, and bullets galore which are sure to tax any gaming system, not to mention the Killer NIC.
Here we see the results for frame rates and ping on Call of Duty 4:
|
Call of Duty 4
– Ping (lower is better) |
||||||
|
Min
|
Max
|
Average
|
||||
|
KillerNIC
|
Onboard
|
KillerNIC
|
Onboard
|
KillerNIC
|
Onboard
|
|
| Test 1 |
152
|
157
|
165
|
175
|
157.7
|
160.8
|
| Test 2 |
154
|
169
|
171
|
189
|
162.8
|
177.4
|
| Test 3 |
157
|
164
|
169
|
188
|
163.5
|
172.2
|
| Test 4 |
151
|
162
|
166
|
191
|
159.4
|
173.3
|
| Test 5 |
156
|
166
|
200
|
182
|
166.4
|
173.7
|
| Test 6 |
161
|
166
|
186
|
192
|
174.2
|
175.7
|
| Test 7 |
159
|
161
|
179
|
179
|
166.2
|
168.4
|
| Test 8 |
167
|
159
|
184
|
163
|
170.1
|
158.7
|
| Test 9 |
155
|
156
|
173
|
178
|
168.3
|
171.2
|
| Test 10 |
160
|
161
|
178
|
181
|
162.4
|
169.9
|
| Mean |
157.2
|
162.1
|
177.1
|
181.8
|
165.1
|
170.1
|
| KNIC/Onb. x100 |
96.98
|
97.41
|
97.06
|
|||
| Standard deviat. |
4.757
|
4.175
|
10.775
|
8.829
|
4.982
|
6.081
|
| Stat. significance |
Yes
|
No
|
Almost
|
|||
| t value |
2.4483
|
1.0669
|
2.0234
|
|||
| P value |
0.0248
|
0.3001
|
0.0581
|
|||
|
Call of Duty 4 – FPS
(higher is better) |
||||||
|
Min
|
Max
|
Average
|
||||
|
KillerNIC
|
Onboard
|
KillerNIC
|
Onboard
|
KillerNIC
|
Onboard
|
|
| Test 1 |
18
|
19
|
81
|
77
|
36.2
|
41.2
|
| Test 2 |
17
|
18
|
120
|
89
|
35.7
|
36.2
|
| Test 3 |
18
|
17
|
87
|
85
|
37.2
|
43.2
|
| Test 4 |
12
|
15
|
94
|
93
|
38.5
|
35.5
|
| Test 5 |
16
|
14
|
124
|
92
|
40.1
|
35.7
|
| Test 6 |
15
|
13
|
86
|
106
|
40.7
|
38.8
|
| Test 7 |
14
|
12
|
65
|
80
|
37.5
|
36.5
|
| Test 8 |
15
|
15
|
110
|
83
|
42.1
|
42.1
|
| Test 9 |
13
|
16
|
94
|
81
|
41.6
|
40.1
|
| Test 10 |
13
|
14
|
101
|
85
|
39.6
|
39.3
|
| Mean |
15.1
|
15.3
|
96.2
|
87.1
|
38.9
|
38.9
|
| KNIC/Onb. x100 |
98.69
|
110.45
|
100.00
|
|||
| Standard deviat. |
2.132
|
2.214
|
18.122
|
8.399
|
2.242
|
2.798
|
| Stat. significance |
No
|
No
|
No
|
|||
| t value |
0.2058
|
1.4407
|
0.0529
|
|||
| P value |
0.8393
|
0.1668
|
0.9584
|
|||
Looking at the frame rate numbers, we see distinct differences in the maximum and minimum frame rates exhibited. The Killer NIC shows the ability of boosting the top end of the frame rates produced, but the averages illustrate no resulting difference. The overall result is that the Killer did not affect frame rates. When we examine the ping numbers, see a minor but distinct trend: the Killer appears to show minor ping improvements across the highs and lows, resulting in a gain of approximately 3% overall. When playing Call of Duty 4, there was not a discernible difference in the ”smoothness” of the game, as was experienced in BF2 and TF2. This may be a result of the game engine, as we know that results vary among different games. Interestingly, even though the numbers illustrate a minor gain in pings, it was not noticed during actual gameplay experience.
Moving the tests to an MMORPG, World of Warcraft needs no introduction. WoW players are a rather … dedicated … group, and while the game is not exactly new, it still has a massive following and is consistently one of the most popular multiplayer games in existence. Interestingly, on a side note, many WoW players continue to play the game on entry-level or older hardware, and are always looking to improve their gaming experience during battles or exhaustive Instances. With our Test System #2 on-line, and representing far more modest hardware gaming capabilities, we tossed the Killer NIC into the World of Warcraft and found some creatures worthy of the tests.
Here we see the results for frame rates and ping on World of Warcraft:
|
World of Warcraft
– Ping (lower is better) |
||||||
|
Min
|
Max
|
Average
|
||||
|
KillerNIC
|
Onboard
|
KillerNIC
|
Onboard
|
KillerNIC
|
Onboard
|
|
| Test 1 |
126
|
164
|
169
|
208
|
143.5
|
191.6
|
| Test 2 |
144
|
155
|
204
|
226
|
185.5
|
195.6
|
| Test 3 |
192
|
198
|
223
|
239
|
213.2
|
210.8
|
| Test 4 |
176
|
179
|
230
|
227
|
200.8
|
201.4
|
| Test 5 |
146
|
202
|
222
|
284
|
194.5
|
219.1
|
| Test 6 |
150
|
146
|
206
|
201
|
165.5
|
169.6
|
| Test 7 |
150
|
148
|
214
|
252
|
176.5
|
191.1
|
| Test 8 |
174
|
204
|
215
|
257
|
191.1
|
223.7
|
| Test 9 |
191
|
167
|
235
|
234
|
203.7
|
206.9
|
| Test 10 |
144
|
174
|
224
|
277
|
187.1
|
217.7
|
| Mean |
159.3
|
173.7
|
214.2
|
240.5
|
186.1
|
217.7
|
| KNIC/Onb. x100 |
91.71
|
89.06
|
85.48
|
|||
| Standard deviat. |
22.351
|
18.654
|
20.244
|
21.741
|
27.249
|
16.410
|
| Stat. significance |
No
|
Yes
|
Almost
|
|||
| t value |
1.4604
|
2.5186
|
2.0156
|
|||
| P value |
0.1614
|
0.0215
|
0.0590
|
|||
|
World of Warcraft – FPS
(higher is better) |
||||||
|
Min
|
Max
|
Average
|
||||
|
KillerNIC
|
Onboard
|
KillerNIC
|
Onboard
|
KillerNIC
|
Onboard
|
|
| Test 1 |
38
|
43
|
134
|
89
|
68.6
|
65.4
|
| Test 2 |
43
|
31
|
93
|
90
|
67.6
|
62.4
|
| Test 3 |
34
|
43
|
108
|
104
|
69.2
|
67.2
|
| Test 4 |
37
|
46
|
102
|
90
|
67.1
|
66.2
|
| Test 5 |
32
|
40
|
128
|
104
|
70.1
|
64.9
|
| Test 6 |
43
|
41
|
113
|
102
|
70.5
|
64.8
|
| Test 7 |
50
|
42
|
88
|
82
|
68.8
|
64.4
|
| Test 8 |
55
|
37
|
98
|
92
|
67.9
|
63.9
|
| Test 9 |
56
|
42
|
101
|
88
|
70.8
|
65.1
|
| Test 10 |
44
|
33
|
116
|
101
|
68.2
|
63.8
|
| Mean |
43.2
|
39.8
|
108.1
|
94.2
|
68.9
|
64.8
|
| KNIC/Onb. x100 |
108.54
|
114.76
|
106.33
|
|||
| Standard deviat. |
8.337
|
14.813
|
1.257
|
4.733
|
7.843
|
1.330
|
| Stat. significance |
No
|
Yes
|
Yes
|
|||
| t value |
1.1215
|
2.6224
|
7.0348
|
|||
| P value |
0.2768
|
0.0173
|
0.0001
|
|||
Here we see a distinct trend in the performance of the Killer. The minimum and average frame rates both showed improvements of approximately 8%, at least double of the other three tested games. However, most significant is the maximum frame rate, which resulted in an increase of approximately 15%. The implication here is that this will possibly aid during periods of heavy action, particularly during lengthy Instances and in notoriously laggy areas such as the Outlands. This is perhaps most significant on entry-levels systems, where performance levels are not comparable to high-end systems, and where improvements are often difficult to achieve. As we examine the ping results, we see the continuation of the trend, with the Killer exhibiting distinct performance increases across the minimum, maximum, and overall average ping numbers. An improvement of 9% in the minimum and overall pings is evident, with the maximum ping exhibiting 12% improvement over the course of the testing. There was a discernible difference in the ”smoothness” during gaming, particularly during heavy battle encounters when the system was pushed harder than when simply moving through the realm. It would appear the Killer enjoys World of Warcraft based on these numbers.
By the Numbers
During the course of this evaluation there has been one basic premise we wished to clearly answer: Does the Killer NIC make a difference, and if so, how much? Not ones to mince words, we’ll give you the short answer and then the long one. Does it work? According to the statistics, it does. And how much? Well, it depends on the game, but the statistical evidence shows you should experience between a 3-8% improvement in your frame rates and pings. That’s the short answer. Now, let’s discuss that a bit further to more fully understand the possible improvements and their implications.
Let’s first look at the facts and hard numbers. As we’ve learned, the Killer NIC is a client-side product that cannot eliminate lag, but rather try to minimize it through various technologies and optimizations. Bigfoot has stated that the Killer’s capabilities can vary, depending on the game engine and other factors. Our test results supports this statement, as we’ve seen various performance increases across a range of popular multiplayer games that employ different engines. We’ve seen virtually no increase in performance in Call of Duty 4, but World of Warcraft showed an overall increase of 8%, with individual statistical increases in the double digits up to 15%. World of Warcraft is one game that Bigfoot touts as a prime example of the Killer’s effectiveness. Again, our numbers suggest that is indeed the case, as WoW showed noticeable gains on an entry-level system. Team Fortress 2 and Battlefield 2 both exhibited minor increases in performance, in the magnitude of approximately 3%.
Editor’s note on the statistics: We spent quite a lot of time crunching numbers and if we summarize the Yes, No and Almost we’ve come up with we have 5 tests that showed a statistically significance, 2 were really close and 17 could not be proven to be significant. This clearly shows that KillerNIC does indeed work, but it depends on the game, and even though 17 of the tests could not be proven to be statistically significant, practically all of them had better means than the on-board NIC.
Beyond the Numbers
During many hours of gaming and testing, there were some effects noticed with the Killer installed that are not fully captured by the numbers and statistics. Three of the four games tested exhibited a ”smoothness” of gameplay that was discernible but not ”proven” by the numbers. This is not to say the numbers were incorrect; far from it. We are very confident of our test samples sizes, and of our results, and will let those numbers rest on their own merits for the Killer. However, there were fewer overall occurrences of stuttering and lag. Call of Duty 4 did not seem to differ at all, but Battlefield 2 was particularly noticeable when the battles got very intense, and Team Fortress 2 also displayed an overall improvement in normally laggy situations.. It would seem that the Killer NIC starts to show its abilities where and when lag is most noticeable, during bouts of heavy fighting, explosions, and action around the player. If you are rather sensitive to lag, then it may be more noticeable than another person.
Next we must keep in mind the FNA apps that are unique to the Killer NIC, and the potential for additional apps to be created by savvy users who download the development kit. There is some very good untapped potential here, and the Killer promises some very interesting network possibilities as a result. However, we are not convinced that most gamers will utilize those features to their potential, and may simply wish to ignore them completely, and just use the Killer for games. There certainly is nothing wrong with this, except that one of the main selling points of the Killer is then rendered moot. Many great ideas are never fully implemented or utilized, and we can’t help but think that this may be one of those instances.
Final thoughts
Now that we’ve answered the basic premise posed in this evaluation, and shown the Killer can make a difference, there is a flip side to some of those numbers: can someone notice a 4% improvement in frame rates, or an 8% improvement in ping? If you are particularly sensitive to lag, and perhaps even a professional gamer, then chances are you may well notice that difference. But if you are an ”average” enthusiast and gamer, will you notice the difference? We’re not entirely convinced you will. However, depending on the game you could notice a distinct difference. A 15% frame rate boost in World of Warcraft is definitely noteworthy and significant. Despite the numbers, there is certainly a degree of personal subjectivity and preference that factors into the satisfaction (or not) of this product. That is something that is not quantifiable, either by numbers or simple observation by another person. The numbers don’t show massive performance increases across the board, but subjectively there can be the result that certain games play smoother. So the question then becomes: what is that worth? And this is where the Killer runs into difficulty. At a cost of approximately $250 US, the Killer is by no means cheap. However, Bigfoot’s lighter Killer K1 model boasts most of its big brother’s claims that seem to matter (including the FNA apps), but runs at reduced clock speeds (that may not make too much difference), but with a price tag of almost $100 less. In fact, the K1 might prove to be a better buy than the flagship M1 for those gamers who want to buy a Killer but aren’t willing to fork out the full $250. And with the potential of using FNA apps, then the Killer moves beyond a ”gaming” product and more of a full-featured ”network” product. If you look at the apps that are included for the Killer and the individual costs of those products separately, then the K1 Killer starts to look like a very viable product.
For people who aren’t particularly sensitive to lag and minor nuanced performance improvements the Killer NIC has to offer, they will likely continue to see it as an exclusive, niche product. However, for those users that truly want peak performance, then the Killer NIC M1 would seem to be a suitable offering for those needs. But the degree of satisfaction will vary since the Killer’s ability to influence and enhance gameplay is rather subtle and not backed by huge performance increases. And for those who want to enjoy the advantages of the Killer NIC but not the stiff price tag, the K1 model may prove to be a viable alternative. We’re not entirely convinced the Killer fully lives up to its name, but we are now certain that it’s no pacifist either.
|
Bigfoot Networks Killer NIC M1
|
|
Pros + Performance increase for frame rates Cons – Performance increases are subtle |
We want to thank Bigfoot Networks for supplying us with this sample for review.


Leave a Reply